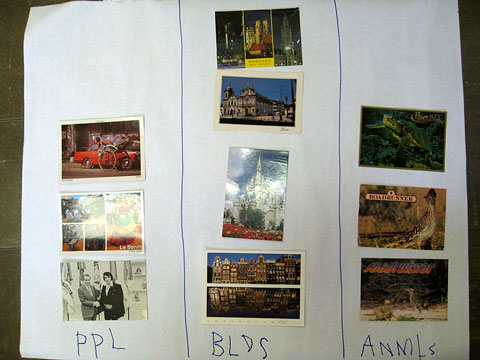
Graphs are tools for visually organizing and comparing data about two or more sets of items. Graphing can be a way for 4- and 5-year-olds to apply what they know about classification, counting, and one-to-one correspondence. Start by making a large grid on paper or fabric to show children how to make “real graphs” with the actual objects that are being counted or compared.
Show the children ways to organize objects to be counted.
- For example, you might start by asking children to look at a bowl filled with 8-10 wrapped granola bars of two different kinds. “I wonder if we have more plain granola bars or more raisin bars. What’s your guess?” Invite them to estimate how many of each kind are in the bowl. Record their guesses on paper.
- Then invite some children to sort the items into two piles. Explain that you now have two sets of things. You might ask, “What do you think now—Are there more plain bars or more raisin bars? Do you want to change your guesses?” Write down their ideas.
Construct a real graph using a grid with large squares.
- Ask the children to count with you as you make a row of one type of item by placing each one in a square on the grid. Explain: “I’m putting all the raisin bars in a row. Each one goes in a separate square, one after the other.” Make a second row of the other type of object.
- Explain that this is a real graph, using real objects. Ask, “What do you notice about this graph?” As children respond, encourage them to explain their answers: “What makes you think so?” or “How can you tell?” Record their ideas next to their earlier estimates.
- Respond to children’s ideas using words such as compare, amount, more, most, less. Watch to see what they understand about making the rows line up with each other. (Some children may not yet understand one-to-one correspondence.)
Encourage other graphing activities.
- Provide grids or graph paper for graphing sets of small objects such as handfuls of coins. Talk with children about their results. “Devontay’s graph has a row of two nickels and a row of three pennies. Eduardo’s graph has three nickels and three pennies. What else do you notice about your two graphs?”
- Encourage children to make real graphs to compare things they are investigating.
- Think of questions that involve children in being part of a real graph. For example, how might they compare the number of people wearing pants with the number of people wearing shorts?
- See if some children are ready to compare more than two sets. “Some of you are wearing long sleeves. Others have short sleeves, and some have no sleeves. How would you show that with a real graph?”
IEL Resource
- Resource List: Math for Preschoolers


 PDF
PDF